
OCEAN & CLIMATE
A warmer ocean. A changing planet.
Read the patterns beneath a sea surface temperature map.
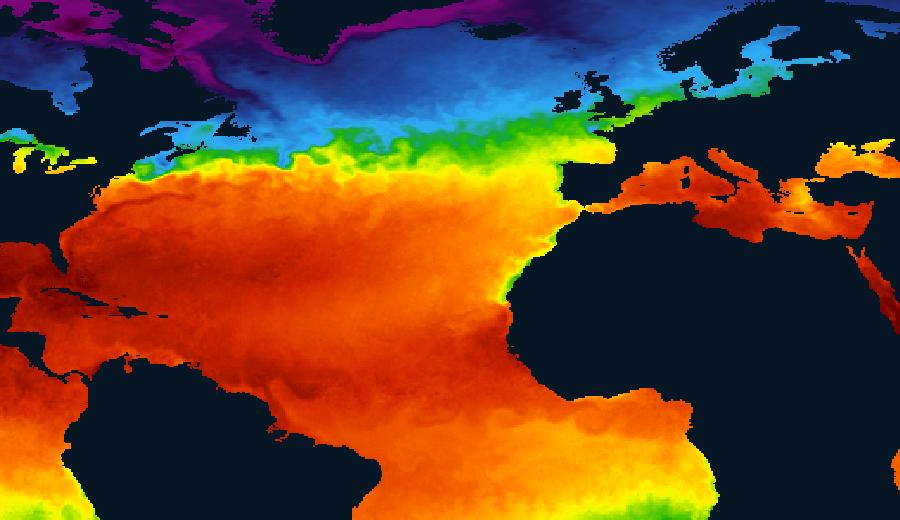 NASA GIBS · 7 September 2026 · visualised data
01 / LOOK
A temperature map tells one part of the story.
The surface ocean is constantly exchanging heat with the atmosphere and transporting it through currents. A warm colour shows temperature, but it does not tell you whether that temperature is unusual for the place and season.
02 / QUESTIONAsk: warmer than what?
An anomaly compares temperature against a specified reference. The MUR25 anomaly product uses its 2003–2014 climatology. The choice of reference matters; a colour alone cannot establish a marine heatwave or explain its cause.
03 / EXPLOREMake your own observation.
Open the layer, select a location and compare the same season in different years. Look for missing coverage. Treat a visual pattern as the start of a question, not the end of an analysis.
Explore this layerSources & further readingNASA PO.DAAC: MUR25 product documentation